Alright. Round 2 . FIGHT!
So, the last time, I figured out, unintentionally, at what times of the day most of my posts happened. This time, I again unintentionally got results different from what I set out to do — I’ll get to this eventually I guess, but for now, the objective is obtaining a measure of the number of posts I make per day and thereby see if I can figure out which days of the week have been the most (least?) productive. Of course, this is still a step away from my eventual goal (hopefully Experiment 3 should sort it out). Let’s get to the methodology —
Step 1 — How do I get the data?
Remember how I downloaded my entire data last time and web-scraped it using scrapy? Well, this time I API-ed my way into getting my data because for a higher level of specificity, sometimes just HTML scraping won’t do. Timestamps were easy enough to fetch from the earlier case, but here I needed date values that were hard to get from the Downloaded Data.zip file. So this data would comprise of the entire stream of my posts all the way from 2008 — when I joined FB to the 23rd of Nov, upto when I retrieved my post details.
-
Get your user access token — I’m sure there’s an OAuth API way to do this, but I did this by manually generating an Access token from the Graph API explorer or Access Token Tool. The former lets you choose permissions on the access token as to what APIs you can open the token up to and also lets you see the expiry time for that token (it’s around an hour from the time of creation. This is the annoying part. Security aside, I’d have really loved a longer expiry time for the access token, but I’m sure once I figure out the API to generate the access token, I can just have my script — see below — fetch it automatically everytime it hits a 401)
-
Get the APIs necessary — Given the nature of my pivot, just the feed API would have done the job for me. But I’ll be using the result of the reactions API in my next blog post, so that’s what I ended up using here as well, in conjunction with the feed API.
A typical feed API call looks like this —
https://graph.facebook.com/v2.5/10152460834423273/feed?limit=25&access_token=EAACEdEose0cBANI6UZBB77zEUEOpKNhxyZA\
uLJozw2uQ18bNIW18Qp1zxSUh6OZC0gONp3B5ZCZCZABqdqWxkg9rcvdleay0BVciZCZA46TMk\
Yog60RZBdnwfpZAaVVMhMKgN90RLMAeJWoKk1eByd\
wXZAU16oZCmoCF1BpCLKK3e4kUGudMHMV11ZBPHZAobYwFUgybgZD&until=1500849601
-
The version number matters because there are some APIs that version-dependant. For example, the reactions API requires v2.6 or higher.
-
The second URI parameter is the user ID that you can also get from the Graph API explorer.
-
The third parameter — limit — is optional because the default value is 25. You can include it if you want to specify higher values i.e fetching more results per page.
-
The fourth parameter is the access token itself obtained in Step (a)
-
The fifth parameter — ‘until’ — is a misnomer. It actually indicates the starting datetime object from when you want to fetch the #limit posts.
The response of this API is of the form :
{
"data" : [
{"message": "FB_Post body_1"
 "created_time": "2017–11–27T12:47:50+0000"
 "id": "1012460834423273_10156427233338273"},
{"message": "FB_Post body_2"
 "created_time": "2017–11–27T10:47:50+0000"
 "id": "1012460834423273_10156427233338273"}
.
.
25 entries ],
"paging": {
"previous": "long obnoxious link1",
"next" : "long obnoxious link2"}
}
I figured that the seemingly useful “next” link is rendered unnecessary if you can find out the date of the last post on that page yourself, convert it into Epoch time and use that value in the “until” parameter mentioned above.
Also, in the response is an inconspicuous little “id”. This little monster is actually an amalgamation of your user_id and the post’s id itself, resulting in another unique id. This is the id to use in the Reactions API that results in obtaining all the reactions for that post enumerated as one of-
{"LIKE”, "ANGRY”, "WOW”, "HAHA”, "LOVE”}
And a typical Reactions API looks like this —
https://graph.facebook.com/v2.6/10152460834423273_10156395770753273/reactions?limit=25&access_token=EAACEdEose0cBANI6UZBB77zEUEOpKNhxyZAuLJozw2uQ18bNIW18Qp1zxSUh6OZC0gONp3B5ZCZCZABqdqWxkg9rcvdleay0BVciZCZA46TMkYog60RZBdnwfpZAaVVMhMKgN90RLMAeJWoKk1eBydwXZAU16oZCmoCF1BpCLKK3e4kUGudMHMV11ZBPHZAobYwFUgybgZD
And the response is —
    {
     "data": [
     {
     "id": "1022218239209614",
     "name": "Name1",
     "type": "HAHA"
     },
     {
     "id": "86372147016752",
     "name": "Name2",
     "type": "WOW"
     },
     .
     .

    ],
     "paging": {
     "cursors": {
     "before": "TVRVNU9EZAzBNamN5TlRveE5URXhNakEyTVRFMU9qYzRPRFkwT0RBek56a3hNek14TWc9PQZDZD",
     "after": "TlRjMk1EWXpNVFF6T2pFMU1URXdNekE0TmpnNk1qVTBNRGsyTVRZAeE13PT0ZD"
     },
     "next": "https://graph.facebook.com/v2.6/10152460834423273_10156395770753273/reactions?access_token=EAACEdEose0cBANI6UZBB77zEUEOpKNhxyZAuLJozw2uQ18bNIW18Qp1zxSUh6OZC0gONp3B5ZCZCZABqdqWxkg9rcvdleay0BVciZCZA46TMkYog60RZBdnwfpZAaVVMhMKgN90RLMAeJWoKk1eBydwXZAU16oZCmoCF1BpCLKK3e4kUGudMHMV11ZBPHZAobYwFUgybgZD&pretty=1&limit=25&after=TlRjMk1EWXpNVFF6T2pFMU1URXdNekE0TmpnNk1qVTBNRGsyTVRZAeE13PT0ZD"
     }
    }
Remember the good ol’ days when there was just a Like button? That’s gone now, so even the simple Like API returns only the number of “Like” reactions you got on a post. So if you wanted the number of Total reactions on your post, the above mentioned API is what you’d want.
Anyway, like I mentioned earlier, to track the number of posts, I could have made do with the Feed API, but using the Feeds, followed by the Reactions API and painstakingly making API calls limiting myself to 25 each time (I didn’t want to get blocked by FB for making too many API calls — which in hindsight was foolish because every click on the website is an API call) , obtaining the last date per page and substituting that in the next API call, I ended up making a CSV of {Total Reactions per post, Date} netting upto around 4500 entries. Next I computed the number of posts per date and obtained another CSV out of that — {#of posts per date, Date}.
I used Python for the entire process —Requests, Numpy and CSV. I used matplotlib for some test graphs as well. The IPython notebooks for the same are provided down below.
Now the data is ready.
Step 2 — Plotting all of this in a nice format
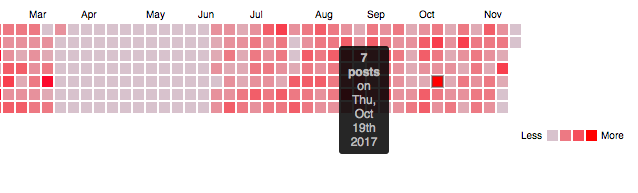
Last time, I’d used a bubble chart to highlight the time of maximum usage. This time, given that it’s panning over a long period of time, I decided to use a Calendar Heatmap rendered again, using D3.JS . Now I’m aware that there are A LOT of different ways to visualise this data. But this is what I went with. I’ll play around with others soon :)
For this, I used a variation of [1], extending the time period to start from Q1 of 2008 as opposed to last year as in [1]. Also, I modified some more parameters to suit my use case, in terms of the width of panning, color ranges for the map, caption etc.
The result was this heatmap — a sample of it is presented below.
Step 3 : Pretend this hasn’t been an enormous waste of time and try to justify what all of this potentially tells me —
It’s still very much an intermediate step into my eventual goal. But what this tells me is what days of the week I’ve been most active on FB and it’s not saying much since I’ve posted continuously for the last 90 days. But the darker shades of red do indicate larger spurts of creative posts (Context — I post original content on my feed — puns, doodles ; I will not comment on the quality though, out of sheer modesty. Ah, meta irony.).
It also allows me to already validate that which I know — the days when I haven’t been active on Facebook at all. The relatively large expanse of empty land in the first half of the snapshot above indicates my brief non-usage of the social networking time-waster.
But I do not begrudge it. It has provided me with an avenue to practice and expand my data visualisation (and eventually, hopefully prediction) learnings.
Notes, potholes, additional learnings —
-
“Not every API calls end up good. Some of them go bad” : I hit some parsing errors when I obtained a 401 because the id I was using was due to posts by friends on my timeline. I ended up filtering calls only on my id after that and validated for 200 OK status codes, only following which parsing should be done.
-
Practicality: This study can potentially be extended to a Digital Marketing use-case where marketers can figure out when they have been most active on their page, as opposed to their profile._
-
Learning: Heatmaps are cool. But it would be cooler to be able to click on each segment and expand it to get more insights per day. I don’t know how to do that yet. I’ll learn and jot it here in a future experiment.
What’s next?
-
The heatmap I’ve generated and the link for which I’ve pasted below takes around 45 friggin’ seconds to load up because of the amount of data it’s loading. I need to read up on caching and loading the page to speed it up. I know I’ll figure it out eventually anway but tips from professionals would be most welcome.
-
Hopefully, there will be no more deviations and I’ll end up actually mining and visualising “that which I originally intended”.
Reference material —
https://developers.facebook.com/tools-and-support/ https://github.com/DKirwan/calendar-heatmap
Source code and other intermediate data —
I’ll expand on the Readme file soon to indicate which files need to be focussed upon in case someone’s interested in contributing. Suffice to say for now that “Reactions1.ipynb”, “Postprocessing.ipynb” and the FB-FrontEnd folder are what are chiefly at play here.
Closer look at the heatmap — Here (You’ll have to wait for 45 seconds for the entire graph to load :-/ Hey, you wait 2 whole minutes for popcorn, don’t you?) — Seriously though, needs speed-up.
Also Published In —
Thanks for reading!